NAVIGATION
AI Product Description Generator Superstar

GRID: Sync & Visualize Data Across Apps in a Smart Interface

GRID: Sync & visualize data from spreadsheets, databases, Notion, and Airtable in a smart, familiar interface. Work smarter, not harder.

4.2(202)
141 comments
303 saves
Visit Website
GRID: Sync & Visualize Data Across Apps in a Smart Interface - Featured on Best AI Tool
Visit Official Website

Ranked in the top 1% of all AI tools in its category

Why GRID Will Blow Your Mind

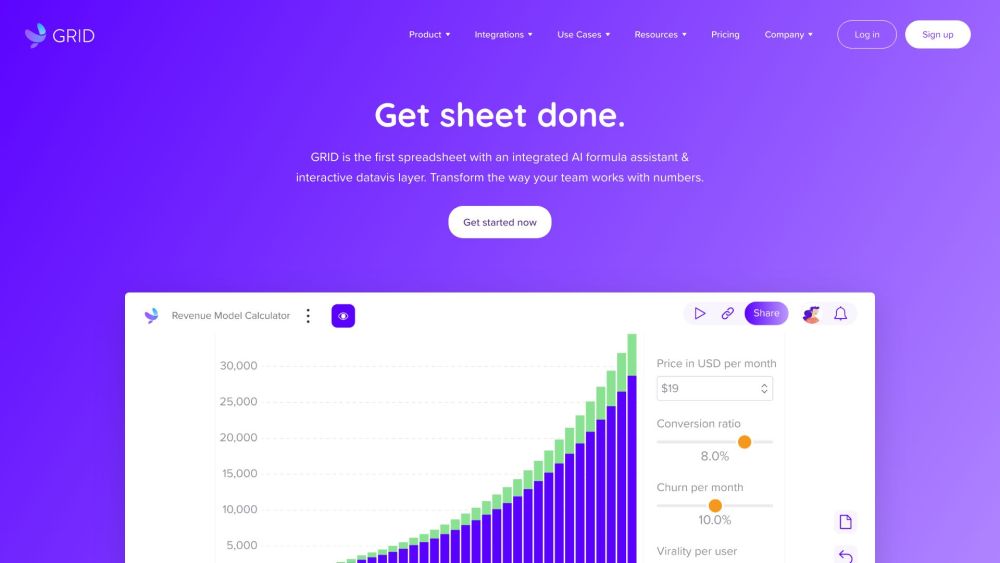
GRID Website screenshot

Introducing GRID: The Smart Data Hub for Modern Teams

GRID transforms how teams interact with data by combining the flexibility of spreadsheets with real-time syncing and dynamic visualizations. It acts as a unified workspace where data from multiple sources—like Google Sheets, Airtable, Notion, and databases—comes together in one intelligent interface. With its intuitive design, GRID empowers users to build interactive models, visualize insights, and share live dashboards across platforms.

Getting Started with GRID

Begin by linking your existing data sources or creating a new dataset directly within GRID. Once connected, use the powerful built-in editor to manipulate data using familiar spreadsheet functions. Choose from a range of visualization tools to turn raw numbers into engaging charts and projections. You can even merge datasets from different apps into a single, cohesive view and seamlessly embed your creations into websites, wikis, or internal tools.

GRID's Magical Features

Key Features of GRID

Real-Time Sync Across Data Sources

Automatically pull and update data from spreadsheets, databases, and popular productivity tools like Notion and Airtable.

Familiar Spreadsheet Experience with Enhanced Capabilities

Leverage standard formulas and cell references while unlocking advanced functionality through an enhanced editing environment.

Deep Integrations with Notion & Airtable

Sync bidirectionally with Notion pages and Airtable bases, turning static records into dynamic, analyzable content.

Interactive Charts and Dynamic Visuals

Create responsive graphs and dashboards that update in real time and respond to user input.

Unified Multi-Source Dashboards

Combine information from disparate systems into a single visualization without manual exports or complex ETL processes.

Embeddable Live Components

Publish interactive reports and widgets directly into your company website, documentation, or knowledge base.

AI-Powered Formula Assistant

Get instant suggestions for formulas based on context, accelerating development and reducing errors.

AI Chart Recommendation Engine

Let GRID recommend the best chart types based on your data structure and intended message.

Common Use Cases for GRID

Design Interactive Business Calculators

Build customizable ROI or pricing calculators for clients or internal stakeholders.

Develop Real-Time Financial Models

Construct adaptable forecasting models that reflect live business metrics.

Generate Marketing & Sales Dashboards

Visualize campaign performance, lead pipelines, and conversion rates with interactivity.

Track Campaign KPIs Dynamically

Monitor key performance indicators across channels with auto-updating scorecards.

Produce Engaging Financial Reports

Create board-ready reports that allow executives to explore underlying assumptions.

Model Revenue Forecasts with Scenario Testing

Run what-if analyses and project growth under various market conditions.

Present Data with Impact

Turn complex datasets into visually compelling stories for presentations and publications.

Burning Questions About GRID

GRID Frequently Asked Questions

What is GRID?

GRID is an intelligent data platform that unifies spreadsheets, databases, and third-party tools into a single interactive surface. It enables real-time data syncing, visualization, and collaboration through a user-friendly spreadsheet-style interface.

How do I get started with GRID?

To begin, connect your preferred data source—such as a Google Sheet, Airtable base, or Notion database—or create a new table inside GRID. Then use the editor to shape your data, generate visuals, and publish interactive outputs.

What does GRID do?

GRID centralizes your data workflows by syncing external sources, enabling rich visual analysis, and supporting collaborative decision-making. It’s ideal for building live dashboards, financial models, and shareable reports with minimal technical overhead.

How do I use GRID effectively?

Start by connecting your data, then apply formulas and formatting using the intuitive editor. Use AI assistants to speed up formula writing and chart selection. Finally, combine multiple datasets and embed the results wherever needed.

What are the main features of GRID?

Core capabilities include cross-platform data synchronization, robust integrations with Notion and Airtable, interactive visualizations, multi-source charting, embeddable components, and AI-driven helpers for formulas and chart design.

Who uses GRID and for what purposes?

Teams use GRID to build business calculators, model financial scenarios, track marketing KPIs, create sales dashboards, forecast revenue, and deliver polished, interactive reports—all within a flexible, no-code environment.