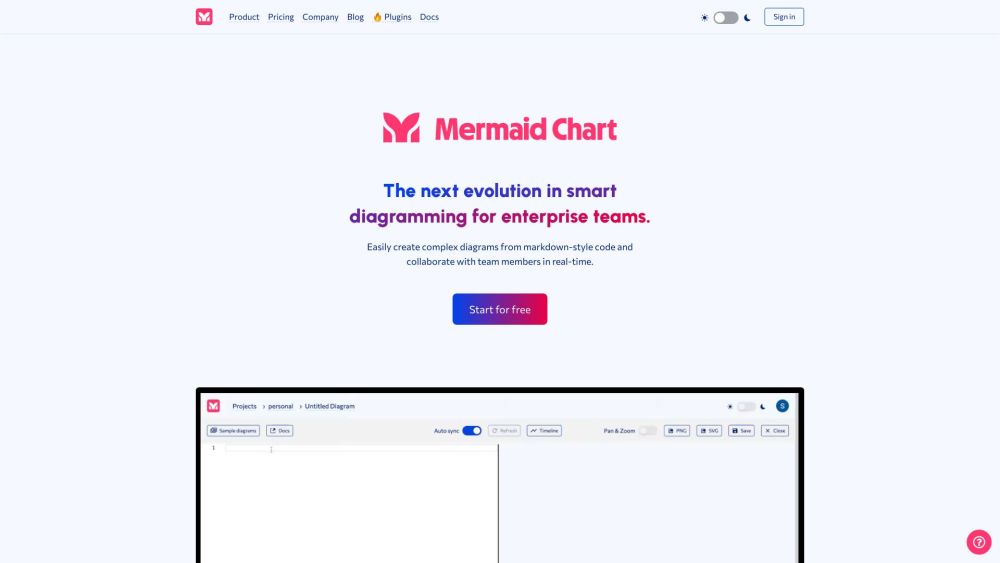
Key Features of Mermaid Chart
Real-Time Collaboration
Work seamlessly with teammates through shared editing environments, enabling live feedback and synchronized updates across distributed teams.
Text-to-Diagram Conversion
Leverage a lightweight, code-like syntax to generate precise diagrams without dragging and dropping shapes—perfect for version control and integration into development workflows.
AI-Powered Diagram Generation
Use artificial intelligence to auto-generate diagrams from natural language descriptions or existing codebases, accelerating documentation and reducing manual effort.
Seamless Code Documentation
Embed diagrams directly into READMEs, wikis, or CI/CD pipelines, ensuring that technical documentation stays up to date with the code.
Team Workflow Integration
Enhance productivity by integrating diagram creation into agile planning, sprint reviews, and system design sessions—all within a developer-first environment.
Dynamic Visualizations
Visualize complex data flows, software architectures, and business processes with clarity and precision, helping teams align around shared technical understanding.
Common Use Cases
Software Architecture Design
Quickly sketch high-level system layouts and microservices interactions using declarative syntax.
Development Documentation
Automate the generation of UML diagrams, state charts, and class structures directly from source code comments.
Business Process Mapping
Model workflows and operational procedures with easy-to-edit textual representations.
Data Pipeline Visualization
Illustrate ETL processes, database schemas, and streaming architectures with minimal overhead.
Network and Infrastructure Planning
Design cloud networks, server topologies, and security models using reproducible text-based templates.
